
Healthcare organizations ask the same analytic questions over and over, yet many teams still rebuild SQL from scratch each time. This guide collects essential SQL patterns for healthcare data analysts and turns them into a practical playbook you can reuse for daily work.
Essential SQL patterns for healthcare data analysts are reusable query structures that answer recurring clinical and operational questions, such as readmission rates, risk tiers, care gaps, and time to event metrics. By standardizing patterns for patient and encounter grain, rolling twelve month windows, and cohort logic, teams deliver faster insights with fewer errors.
You will see ten patterns, each with a scenario, a simple picture of the tables, and a reusable SQL snippet. At the end, the CARE SQL Pattern Stack ties everything together into a repeatable way of working.
A Quick Mental Model For Healthcare Relational Data
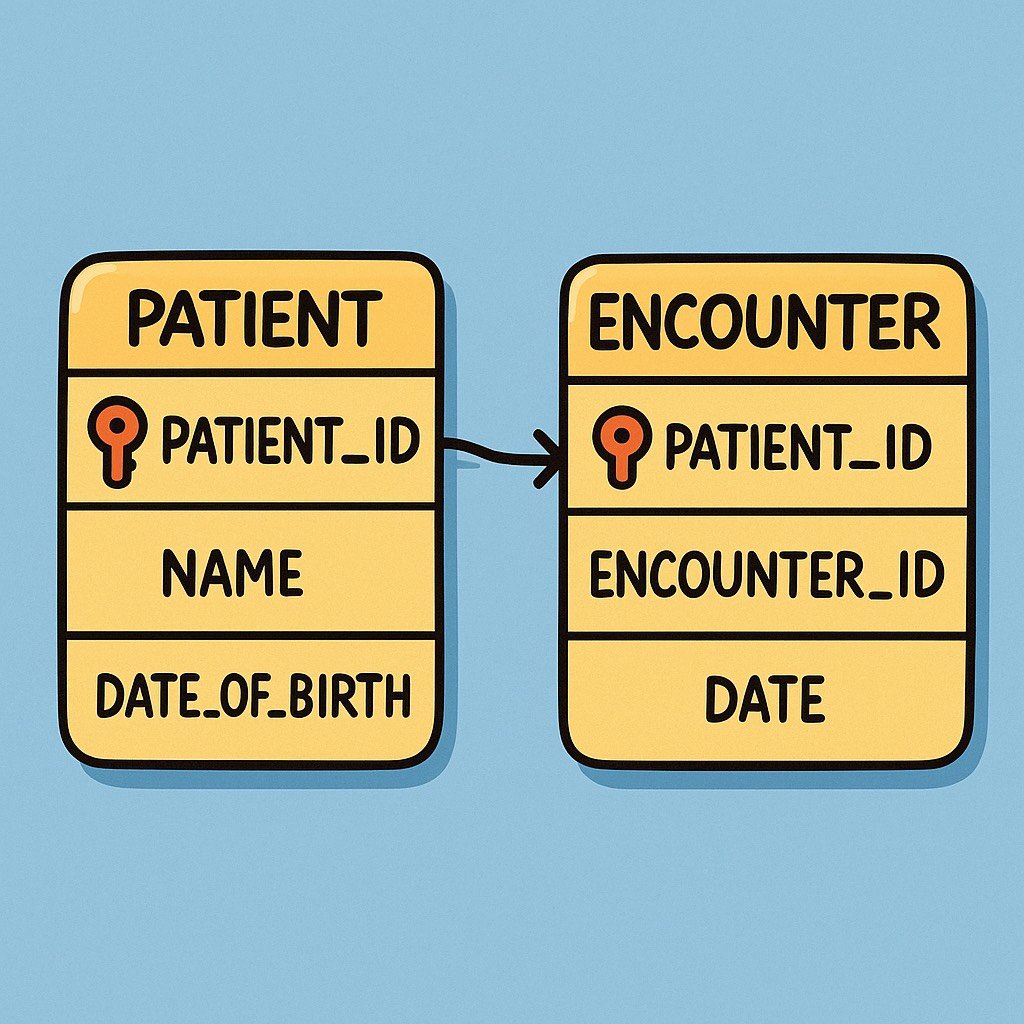
Before touching SQL, it helps to picture the data model in your head. In most environments, you can think in four core tables:
- Patient
- patient_id, date_of_birth, sex, death_date
- Encounter
- encounter_id, patient_id, admit_date, discharge_date, encounter_type
- Diagnosis
- encounter_id, diagnosis_code, diagnosis_type
- Claim or Charge
- claim_id, encounter_id, allowed_amount
The critical idea is grain, the unit that each row represents. Patient tables are patient level, encounter tables are encounter level, claims are sometimes line level. Many analytic mistakes in healthcare come from mixing grains and double counting encounters or patients.
Keep this simple model in mind as we move through the patterns. Each one is really a disciplined way to jump between grains without losing the story.
Pattern 1: Patient Level and Encounter Level Aggregation
A medical group wants to know: out of 12,000 active patients, how many had at least 1 hospital admission this year, and how many total admissions occurred
Tables in play
- Patient
- Encounter
Think of Patient as one row per person, Encounter as one row per stay. The pattern is: aggregate at the encounter level, then roll up to patient level only when needed.
-- encounter level count by patient
WITH encounter_year AS (
    SELECT
        e.patient_id,
        e.encounter_id
    FROM encounter e
    WHERE e.admit_date >= DATEFROMPARTS(2024, 1, 1)
      AND e.admit_date <  DATEFROMPARTS(2025, 1, 1)
)
SELECT
    COUNT(*) AS total_encounters,
    COUNT(DISTINCT patient_id) AS patients_with_encounter
FROM encounter_year;
If you instead join Patient and then group only by patient_id, you would lose the total encounter count. If you group only by encounter_id, you cannot answer patient level questions.
Mini case 1
National programs such as the Medicare readmission measures rely on a clear index encounter followed by a readmission within 30 days, and they treat index stays and readmissions as separate encounter level events.[1] This makes consistent patient and encounter grain handling a foundation for any quality metric.
This pattern is your starting point for everything that follows, because nearly every measure depends on a clean denominator of patients and a correct count of encounters.
Pattern 2: Joining Patient Encounter Diagnosis and Claim Tables
Now imagine a population health team wants the total allowed cost for inpatient stays where diabetes was present.
Tables in play
- Patient
- Encounter
- Diagnosis
- Claim
Visually, you can imagine Encounter at the center. Diagnosis and Claim attach to each encounter, and Patient attaches above all encounters for a person.
WITH diabetes_encounters AS (
    SELECT DISTINCT
        e.encounter_id,
        e.patient_id
    FROM encounter e
    JOIN diagnosis d
        ON d.encounter_id = e.encounter_id
   WHERE d.diagnosis_code LIKE 'E11%'
)
SELECT
    de.patient_id,
    COUNT(DISTINCT de.encounter_id) AS diabetes_encounter_count,
    SUM(c.allowed_amount) AS total_allowed_amount
FROM diabetes_encounters de
JOIN claim c
    ON c.encounter_id = de.encounter_id
GROUP BY
    de.patient_id;
This join pattern appears in many tasks, from cost of readmissions to comorbidity scoring. The key steps are:
- Identify the clinical concept at encounter level using Diagnosis.
- Reduce to unique encounters in a common table expression.
- Attach financial data from Claim for cost calculations.
Robust quality dashboards that connect outcomes and cost follow exactly this chain of relationships.[8]
Pattern 3: Rolling Twelve Month Windows For Rates and Utilization
Leadership asks: what is our unplanned readmission rate for each month, using a rolling twelve month rate so that seasonal swings are smoothed out
Many health systems and payers monitor quality with rolling twelve month windows because they better approximate year end results while still updating monthly.[4][9]
Tables in play
- Encounter
- A Date dimension or calendar table (optional but helpful)
Think of each index discharge as a candidate for readmission within 30 days. For simplicity, this example counts any second inpatient stay within 30 days as a readmission.
WITH index_stays AS (
    SELECT
        e.encounter_id,
        e.patient_id,
        e.discharge_date
    FROM encounter e
    WHERE e.encounter_type = 'INPATIENT'
),
readmissions AS (
    SELECT DISTINCT
        i.encounter_id AS index_encounter_id
    FROM index_stays i
    JOIN encounter r
        ON r.patient_id = i.patient_id
       AND r.admit_date > i.discharge_date
       AND r.admit_date <= DATEADD(day, 30, i.discharge_date)
       AND r.encounter_type = 'INPATIENT'
),
monthly_rates AS (
    SELECT
        DATEFROMPARTS(YEAR(discharge_date), MONTH(discharge_date), 1) AS month_start,
        COUNT(*) AS index_count,
        SUM(CASE WHEN i.encounter_id IN (SELECT index_encounter_id FROM readmissions)
                 THEN 1 ELSE 0 END) AS readmit_count
    FROM index_stays i
    GROUP BY DATEFROMPARTS(YEAR(discharge_date), MONTH(discharge_date), 1)
),
rolling_twelve AS (
    SELECT
        m1.month_start,
        SUM(m2.index_count) AS index_12m,
        SUM(m2.readmit_count) AS readmit_12m
    FROM monthly_rates m1
    JOIN monthly_rates m2
        ON m2.month_start <= m1.month_start
       AND m2.month_start > DATEADD(month, -12, m1.month_start)
    GROUP BY m1.month_start
)
SELECT
    month_start,
    readmit_12m * 1.0 / NULLIF(index_12m, 0) AS readmit_rate_12m
FROM rolling_twelve
ORDER BY month_start;
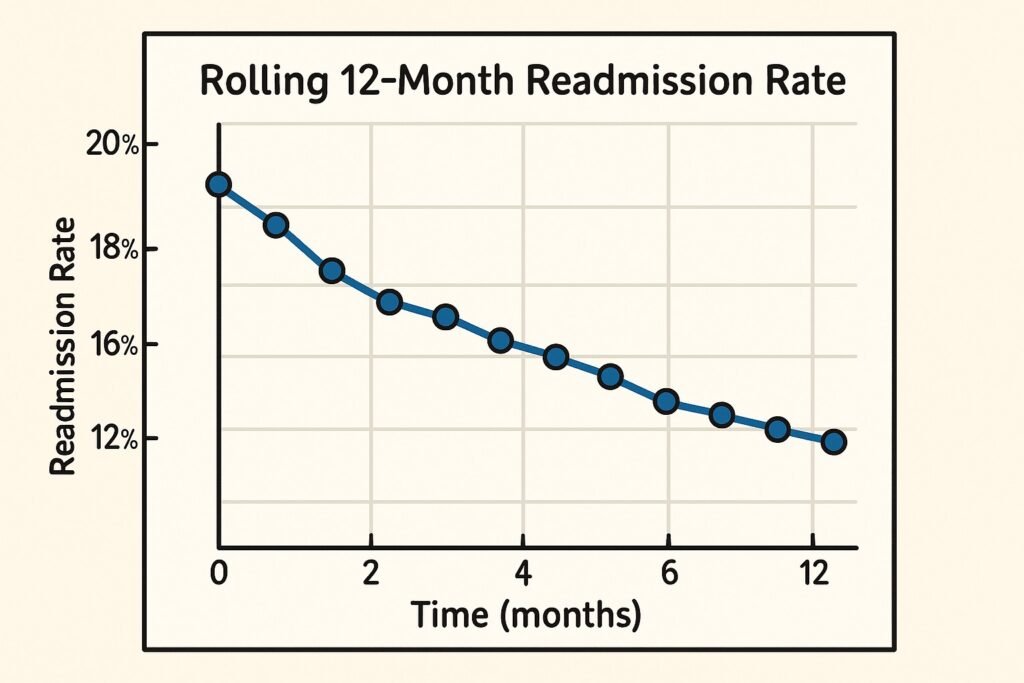
Studies of quality reporting methods have shown that rolling twelve month approaches often give the closest prediction of final annual performance, especially when combined with graphical displays.[4][9] This pattern is directly reusable for emergency department visits, care gap closure, and chronic disease control rates.
Pattern 4: Risk Stratification With Case Expressions
Care management teams often want a simple list: low, medium, and high risk patients for the next outreach campaign. Criteria can combine comorbidities, utilization, and cost.
Evidence from readmission and mortality prediction research shows that risk increases with higher comorbidity counts, more prior admissions, and certain chronic conditions.[1][3][10]
Tables in play
- Patient
- Encounter
- Diagnosis
Imagine a derived summary table per patient with three ingredients: number of inpatient stays in the past year, comorbidity count, and any flag for specific conditions such as heart failure.
WITH patient_summary AS (
    SELECT
        p.patient_id,
        COUNT(CASE WHEN e.encounter_type = 'INPATIENT'
                   AND e.admit_date >= DATEADD(year, -1, GETDATE())
              THEN 1 END) AS inpatient_last_12m,
        COUNT(DISTINCT CASE WHEN d.diagnosis_type = 'CHRONIC'
                             THEN d.diagnosis_code END) AS chronic_condition_count
    FROM patient p
    LEFT JOIN encounter e
        ON e.patient_id = p.patient_id
    LEFT JOIN diagnosis d
        ON d.encounter_id = e.encounter_id
    GROUP BY p.patient_id
)
SELECT
    patient_id,
    inpatient_last_12m,
    chronic_condition_count,
    CASE
        WHEN inpatient_last_12m >= 2
          OR chronic_condition_count >= 5 THEN 'High'
        WHEN inpatient_last_12m = 1
          OR chronic_condition_count BETWEEN 3 AND 4 THEN 'Medium'
        ELSE 'Low'
    END AS risk_tier
FROM patient_summary;
This pattern makes your logic auditable. Clinicians can see the exact cutoffs, compare them with program criteria, and adjust as evidence evolves.
Pattern 5: Cohort Creation With Clear Inclusion Logic
Quality measures and research projects nearly always start with a cohort definition. For example, consider adults with heart failure seen in the last year, excluding those who died, where we want to track follow up within 14 days after discharge.
Many quality measurement guides stress the importance of clear denominator definitions and separate inclusion and exclusion steps.[4][6]
Tables in play
- Patient
- Encounter
- Diagnosis
Here is a general pattern using common table expressions to keep logic modular.
WITH base_population AS (
    SELECT DISTINCT
        p.patient_id
    FROM patient p
    JOIN encounter e
        ON e.patient_id = p.patient_id
   WHERE e.discharge_date >= DATEADD(year, -1, GETDATE())
     AND p.date_of_birth <= DATEADD(year, -18, GETDATE())
),
heart_failure_dx AS (
    SELECT DISTINCT
        e.patient_id
    FROM encounter e
    JOIN diagnosis d
        ON d.encounter_id = e.encounter_id
   WHERE d.diagnosis_code LIKE 'I50%'
),
exclusions AS (
    SELECT
        patient_id
    FROM patient
    WHERE death_date IS NOT NULL
)
SELECT
    b.patient_id
FROM base_population b
JOIN heart_failure_dx h
    ON h.patient_id = b.patient_id
LEFT JOIN exclusions x
    ON x.patient_id = b.patient_id
WHERE x.patient_id IS NULL;
This separation mirrors how measure stewards publish specifications, which makes your SQL easier to validate and maintain over time.[6]
Pattern 6: Flagging First Versus Subsequent Events
Suppose you want to distinguish a patient’s first emergency department visit for asthma from repeat visits within 90 days. This matters for understanding whether care plans are working or simply cycling patients through the same doors.
Time to event research often counts prior hospitalizations as strong predictors of future events, so correctly distinguishing first events from follow up events is crucial.[10][11]
Tables in play
- Encounter
- Diagnosis
Picture all asthma related encounters for each patient sorted by date. The first is your index event, the rest are repeats.
WITH asthma_ed AS (
    SELECT
        e.patient_id,
        e.encounter_id,
        e.admit_date,
        ROW_NUMBER() OVER (
            PARTITION BY e.patient_id
            ORDER BY e.admit_date
        ) AS rn
    FROM encounter e
    JOIN diagnosis d
        ON d.encounter_id = e.encounter_id
   WHERE d.diagnosis_code LIKE 'J45%'
     AND e.encounter_type = 'ED'
)
SELECT
    patient_id,
    encounter_id,
    admit_date,
    CASE
        WHEN rn = 1 THEN 'First'
        ELSE 'Subsequent'
    END AS event_flag
FROM asthma_ed;
You can adapt this pattern for first cancer screening, first prescription fill, or first admission in an episode. The only changes are the filter conditions and any allowed lookback period.
Pattern 7: Time To Event and Survival Style Queries
Clinicians often ask questions like: how many days after discharge do readmissions usually occur, and how does that differ by risk tier
Time to event analysis, also called survival analysis, is widely used in cardiovascular and chronic disease research to describe time from a starting event to death, readmission, or other outcomes.[5][11][19]
Tables in play
- Encounter
- Patient or risk tier table from Pattern 4
The idea is to pair each index discharge with the next relevant event date, or a censoring date if no event occurs during the follow up period.
WITH index_stays AS (
    SELECT
        e.patient_id,
        e.encounter_id,
        e.discharge_date
    FROM encounter e
    WHERE e.encounter_type = 'INPATIENT'
),
next_events AS (
    SELECT
        i.patient_id,
        i.encounter_id AS index_encounter_id,
        MIN(e2.admit_date) AS next_admit_date
    FROM index_stays i
    LEFT JOIN encounter e2
        ON e2.patient_id = i.patient_id
       AND e2.admit_date > i.discharge_date
       AND e2.encounter_type = 'INPATIENT'
       AND e2.admit_date <= DATEADD(day, 90, i.discharge_date)
    GROUP BY
        i.patient_id,
        i.encounter_id
)
SELECT
    n.patient_id,
    n.index_encounter_id,
    CASE
        WHEN n.next_admit_date IS NOT NULL
             THEN DATEDIFF(day, i.discharge_date, n.next_admit_date)
        ELSE DATEDIFF(day, i.discharge_date, DATEADD(day, 90, i.discharge_date))
    END AS days_to_event,
    CASE
        WHEN n.next_admit_date IS NOT NULL THEN 1
        ELSE 0
    END AS event_indicator
FROM next_events n
JOIN index_stays i
    ON i.encounter_id = n.index_encounter_id;
This output can feed into more advanced tools for survival curves or hazard models, but the core pairing logic lives here in SQL. Studies that apply survival inspired models to readmission risk often start from very similar input tables.[3][11]
Pattern 8: Detecting Gaps In Care
A diabetes registry coordinator wants a list of patients overdue for HbA1c testing according to guideline based intervals. Many guidelines recommend at least two tests per year for patients with stable diabetes, and more frequent testing when therapy is changing or control is poor.[2][3][21]
Tables in play
- Patient
- Lab_result (one row per test)
Imagine each patient with a list of HbA1c test dates. You want the last date and the number of days since that test.
WITH a1c_last AS (
    SELECT
        l.patient_id,
        MAX(l.result_date) AS last_a1c_date
    FROM lab_result l
    WHERE l.test_code = 'HBA1C'
    GROUP BY l.patient_id
)
SELECT
    p.patient_id,
    a.last_a1c_date,
    DATEDIFF(day, a.last_a1c_date, GETDATE()) AS days_since_last_a1c,
    CASE
        WHEN a.last_a1c_date IS NULL THEN 'Never done'
        WHEN DATEDIFF(day, a.last_a1c_date, GETDATE()) > 365 THEN 'Overdue'
        ELSE 'Up to date'
    END AS a1c_status
FROM patient p
LEFT JOIN a1c_last a
    ON a.patient_id = p.patient_id;
Mini case 2
Large observational studies of diabetes populations show that many patients receive HbA1c tests less frequently than recommended, and that shorter intervals of around three months can support better control during periods of treatment adjustment.[3][9][21] A simple gap detection query like this can power outreach lists and track adherence to monitoring standards.
Pattern 9: Selecting The Latest Record Per Patient
You are asked: for each patient, show the most recent address and phone number from a contact table, or the most recent serum creatinine from lab results.
This pattern underlies almost every registry, where the latest value of a clinical or demographic attribute is needed for reporting.[8]
Tables in play
- Patient
- Contact or Lab_result
There are two common approaches. The window function version is often easiest to read.
WITH latest_contact AS (
    SELECT
        c.patient_id,
        c.address_line1,
        c.city,
        c.state,
        c.phone_number,
        c.updated_at,
        ROW_NUMBER() OVER (
            PARTITION BY c.patient_id
            ORDER BY c.updated_at DESC
        ) AS rn
    FROM contact c
)
SELECT
    patient_id,
    address_line1,
    city,
    state,
    phone_number,
    updated_at
FROM latest_contact
WHERE rn = 1;
A correlated subquery version can be useful when window functions are not available.
SELECT
    c.patient_id,
    c.address_line1,
    c.city,
    c.state,
    c.phone_number,
    c.updated_at
FROM contact c
WHERE c.updated_at = (
    SELECT MAX(c2.updated_at)
    FROM contact c2
    WHERE c2.patient_id = c.patient_id
);
Choose the version that best matches your database capabilities and performance needs.
Pattern 10: Lightweight Data Quality Checks With SQL
Before shipping any new dataset, you should run basic data quality checks. Public health initiatives and practice transformation programs emphasize the need for consistent count checks and simple distributions before quality measures are trusted.[4][6][22]
Tables in play
- Any table feeding dashboards or extracts
Here is a simple pattern you can wrap into a reusable script.
SELECT
    'encounter' AS table_name,
    COUNT(*) AS row_count,
    COUNT(DISTINCT patient_id) AS distinct_patient_count,
    COUNT(CASE WHEN discharge_date IS NULL THEN 1 END) AS missing_discharge_date
FROM encounter;

SELECT
    encounter_type,
    COUNT(*) AS encounter_count
FROM encounter
GROUP BY encounter_type;

SELECT
    CASE
        WHEN discharge_date < admit_date THEN 'Date anomaly'
        ELSE 'Normal'
    END AS date_check,
    COUNT(*) AS row_count
FROM encounter
GROUP BY
    CASE
        WHEN discharge_date < admit_date THEN 'Date anomaly'
        ELSE 'Normal'
    END;
These quick checks often catch issues such as truncated loads, missing identifiers, or impossible dates long before they surface as odd quality scores. The ability of practices to report reliable measures has been strongly linked to their capacity for this type of basic data validation.[6]
The CARE SQL Pattern Stack Playbook
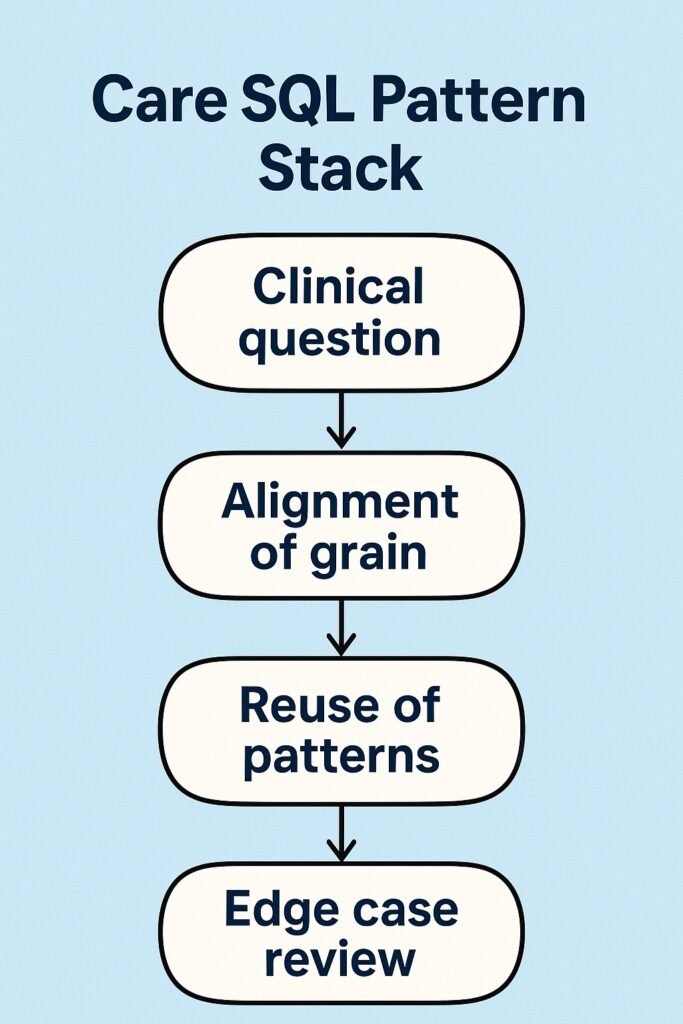
At this point we have many moving pieces. To make them usable in daily work, let us group them into the CARE SQL Pattern Stack
- Clinical question
- Alignment of grain
- Reuse of patterns
- Edge case review
Here is how to apply it.
Step 1: Clinical question
Write down the decision, the population, the metric, and the time frame.
Example:
Care managers want to reduce 30 day readmissions for heart failure patients, focusing on patients at highest risk this quarter.
Step 2: Alignment of grain
Choose the grain that matches the main outcome. For readmissions, that is encounter level. For outreach lists, the grain will be patient level.
In our example, we will:
- Start at encounter level to define index stays and readmissions (Patterns 1, 3, 7).
- Then roll to patient level for risk tiers and outreach lists (Patterns 4, 8, 9).
Step 3: Reuse of patterns
Map the question to the patterns:
- Use Pattern 5 to define the heart failure cohort.
- Use Pattern 3 for rolling twelve month readmission rates.
- Use Pattern 4 to stratify patients into risk tiers.
- Use Pattern 7 to compute time to readmission, which helps understand when to focus interventions.[3][5][11]
By recognizing these patterns, you avoid inventing new logic that may be inconsistent with earlier work. This is exactly how high performing practices manage to maintain many quality measures from electronic health records at scale.[4][6][28]
Step 4: Edge case review
Finally, review details that can change the result:
- How to handle transfers or observation stays
- Which diagnosis codes define heart failure
- Whether deaths should be censored endpoints or competing risks
- How to treat patients lost to follow up
This step mirrors quality measure technical documentation and survival analysis practice, where careful censoring definitions are central.[1][5][19]
Run through these four steps whenever you start a new request, and the ten patterns in this article will feel less like code snippets and more like a compact language you can speak with clinicians and leaders.
How Essential SQL Patterns For Healthcare Data Analysts Fit Together
Taken together, these patterns form a reusable toolkit:
- Patterns 1 and 2 keep patient and encounter grain straight and correctly link core tables.
- Patterns 3 and 7 handle time, from rolling windows to time to event.
- Patterns 4, 5, and 8 create cohorts, risk tiers, and care gap flags that match clinical programs.
- Patterns 6 and 9 mark first versus subsequent events and find latest values.
- Pattern 10 protects everything with quick data quality checks.
The more consistently your team applies essential SQL patterns for healthcare data analysts, the easier it becomes to compare metrics across time, teams, and systems.
FAQ For Healthcare SQL Practice
Q Why do my patient counts sometimes change when I rerun a query
Because inclusion criteria and measurement periods are time based, patients can age into or out of cohorts. Always log your measurement period and cohort logic so results are reproducible.
Q Do I always need a date dimension table for rolling windows
No, but a date table often simplifies monthly and quarterly aggregations and makes it easier to join multiple measures on the same calendar.
Q How can I validate that my cohort and risk stratification logic is correct
Start with a small sample of patients, review their charts with clinicians, and confirm that each one belongs in the assigned cohort and tier.
Q Which database features matter most for these patterns
Window functions, common table expressions, and reliable date functions are the most important. They make patterns like first event, rolling windows, and latest value significantly easier to implement.
Q How should I share these patterns inside my organization
Create a shared code repository or script library with clearly named snippets for each pattern and brief usage notes, and review them during analytics team meetings.
Key Takeaways
- Most recurring healthcare analytics questions can be answered from ten SQL patterns built on patient and encounter grain.
- Rolling twelve month windows, cohort definitions, and risk tiers are core building blocks for quality improvement and care management.
- Time to event queries prepared in SQL give clinicians a more realistic view of how quickly events such as readmissions occur.
- Lightweight data quality checks catch many extract problems before they distort quality measures and operational dashboards.
- The Care SQL Pattern Stack gives analysts a repeatable way to connect clinical questions to precise, reusable SQL patterns.
More Articles on Informessor
1 in 3 Home Care Patients End Up Hospitalized. This AI Platform Is Built to Stop That.
I stumbled on BetweenVisits.org a little while back and, honestly, I couldn’t stop thinking about…
How Ambient AI Scribes Are Reshaping Health Informatics Careers in 2026
There’s a quiet revolution happening inside exam rooms across the country, and most people outside…

Top Health Informatics News From Q1 2026: What You Need to Know
Health informatics had a busy 1st quarter in the US, and honestly, a lot of…

The Hidden Costs of Bad Data in Healthcare
In hospitals, healthcare data is not just a record of what happened. It is the input that…

How Health Informatics Transforms Patient Outcomes
If you have ever wondered why a correct diagnosis does not always translate into better…

Healthcare Data Quality Framework to Fix Broken Dashboards
If you have ever shipped a dashboard you were proud of, only to watch it…

References
[1] Dhaliwal J S, King K C. Reducing Hospital Readmissions. StatPearls Publishing. Updated 2024. Available at: https://www.ncbi.nlm.nih.gov/books/NBK606114/ NCBI
[2] American Diabetes Association. Glycemic Targets Standards of Care in Diabetes 2023. Diabetes Care. 2023. Available at: https://diabetesjournals.org/care/article/46/Supplement_1/S97/148053 Diabetes Journals
[3] Lyon A W et al. Variation in the Frequency of Hemoglobin A1c Testing in Patients with Diabetes. Canadian Journal of Diabetes. 2009. Available at: https://pmc.ncbi.nlm.nih.gov/articles/PMC2769871/ PMC
[4] Colin N V et al. Understanding the Impact of Variations in Measurement Periods on the Assessment of Quality of Care. Journal of Ambulatory Care Management. 2018. Available at: https://pmc.ncbi.nlm.nih.gov/articles/PMC6078150/ PMC+1
[5] Denfeld Q E et al. Survival Analysis 101 An Easy Start Guide to Analyzing Time to Event Data. Journal of Cardiovascular Nursing. 2023. Available at: https://pmc.ncbi.nlm.nih.gov/articles/PMC10957029/ PMC
[6] Parchman M L et al. Ability of Primary Care Practices to Measure and Improve Quality of Care. Journal of the American Board of Family Medicine. 2024. Available at: https://www.jabfm.org/content/jabfp/37/2/316.full.pdfJABFM
[7] Kern L M et al. Association Between Patients Self Reported Gaps in Care Coordination and Preventable Adverse Outcomes. Journal of General Internal Medicine. 2020. Available at: https://pmc.ncbi.nlm.nih.gov/articles/PMC7728843/ PMC
[8] Baus A et al. Leveraging Electronic Health Records Data for Enhanced Public Health Surveillance. Preventing Chronic Disease. 2020. Available at: https://pmc.ncbi.nlm.nih.gov/articles/PMC9150493/ PMC
[9] Johnson T R et al. Evaluation of Methods for Monitoring Annual Quality Measures. MedRxiv preprint. 2021. Available at: https://pmc.ncbi.nlm.nih.gov/articles/PMC6078150/ MedRxiv+1
[10] Todd J. Survival Analysis Techniques and Applications for Hospital Readmission Risk. Doctoral Thesis. Bond University. 2021. Available at: https://pmc.ncbi.nlm.nih.gov/articles/PMC11559171/ PMC+1
[11] Pons Suñer P et al. Prediction of 30 Day Unplanned Hospital Readmission. Heliyon. 2023. Summary available in abstract. ScienceDirect
[19] Denfeld Q E et al. Survival Analysis 101 An Easy Start Guide to Analyzing Time to Event Data. Journal of Cardiovascular Nursing. 2023.