
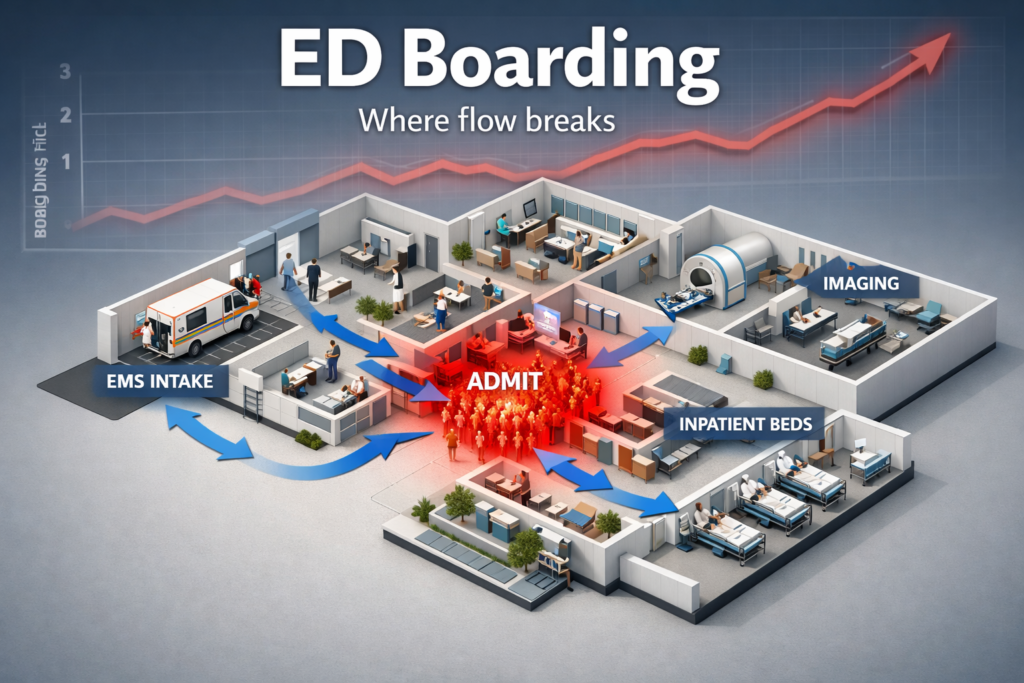
Walk into almost any busy emergency department and you will feel it before you measure it.
The waiting room is full, but the bigger problem is hidden behind the doors. Hallway beds. Patients who already need inpatient care still parked in the emergency department because there is nowhere to send them. Clinicians working at sprint pace while trying to maintain precision. Families watching the clock and wondering when care will actually start.
This is not simply an emergency department problem. It is a hospital wide flow problem that shows up first and loudest in emergency care. When the system runs out of slack, the emergency department becomes the pressure valve for everything else: inpatient capacity, post acute placement, behavioral health access, fragmented records, and delays in diagnostics and consults.
In 2026, the stakes rise even more because measurement and accountability are tightening. Emergency care access and timeliness is moving closer to the center of quality conversations, including federal reporting efforts and composite measures that make long waits and boarding harder to ignore. Research using access metrics shows worsening performance over time, which signals a system trend, not a series of one off bad days. [12]
The good news is that emergency care is also one of the clearest places to improve operational outcomes with informatics. Not by adding yet another tool on top of a strained workforce, but by removing friction: better visibility, better prediction, cleaner handoffs, and smarter routing to the right level of care.
This article breaks down what is driving the breaking point and then lays out a practical informatics playbook to reduce bottlenecks, improve triage, and move patients through the system faster in 2026.
Quick Answer to How Health Informatics Can Help
Emergency care breaks when hospital flow breaks. The highest leverage fixes are not only inside the emergency department. They connect triage, diagnostics, bed management, and discharge pathways into one measurable system. Health informatics helps by forecasting demand, making bottlenecks visible in real time, standardizing triage and ordering, and improving transitions of care across settings. The goal is simple: shorter waits, fewer walkaways, less boarding, and safer care.
The Anatomy of ED Strain
Emergency departments are struggling for reasons that compound each other. It is tempting to point to volume and stop there, but the more accurate story is capacity mismatch across the entire continuum.
1) Demand is more complex, not just higher
Many systems are seeing higher acuity and more clinical complexity in the emergency department. That changes throughput because complex patients need longer evaluation, more monitoring, more consults, and more coordinated discharge planning. Industry benchmarking and operational reporting consistently highlight rising acuity and longer processing times, which means the same department can safely complete fewer visits per hour even if staffing holds steady. [7] [3]
2) Staffing strain changes throughput physics
When staffing is thin, every minute of wasted motion becomes a delay. A bed that is not turned over quickly stays blocked longer. A consult that takes one more hour forces another patient to wait. A discharge that is missing one form keeps an inpatient bed occupied, which keeps an admitted emergency patient in the emergency department.
Professional groups describing the boarding crisis consistently link the problem to workforce strain and burnout, which worsens cycle time and makes retention harder. [1]
3) Diagnostic and consult delays add invisible queue time
Throughput is not only clinician time. It is also the time it takes to obtain imaging, complete lab work, and get consult decisions. When radiology backlogs grow or transport is short staffed, the emergency department becomes a holding area for diagnostic completion, even for patients who will ultimately be discharged.
AHRQ has long emphasized that patient flow issues are system issues that include diagnostics, bed assignment, inpatient capacity, and discharge processes. [2]
4) Behavioral health and post acute constraints create long dwell time
A major driver of crowding is the inability to place patients who need psychiatric care, long term services, skilled nursing, or rehab. When downstream options are limited, the emergency department becomes the default holding area because it is open at all hours and cannot refuse evaluation. Professional statements and national reporting repeatedly call out the boarding burden for mental health patients as a critical part of the crisis. [1]
5) Fragmented information causes duplicate work and slow decisions
Even with modern EHRs, emergency teams still face information gaps: missing medication history, incomplete problem lists, scattered external records, unclear goals of care, and limited visibility into recent imaging or specialty plans from outside institutions. Those gaps matter because emergency medicine is the discipline of time boxed decision making under uncertainty. When uncertainty increases, clinicians order more tests and keep patients longer, which increases crowding and boarding risk.
Interoperability progress is real, but uneven. Standards like HL7 FHIR exist to exchange health information electronically and are increasingly used in real world implementations. [9] Yet many workflows still fail to deliver the right data at the moment of triage and disposition.
Boarding Is The Multiplier: Why Inpatient Flow Owns The ED
If you want one concept that explains why emergency care feels like it is breaking, it is boarding.
Boarding happens when a patient who needs inpatient admission remains in the emergency department after the decision to admit because an inpatient bed or appropriate placement is not available. This is commonly framed as an emergency department crowding issue, but the more accurate framing is output failure. The emergency department cannot move admitted patients out, so it cannot create space for new arrivals.
Boarding expands from inconvenience to safety risk
When boarded patients remain in emergency spaces, care processes degrade. AHRQ safety literature describes boarded patients as more likely to experience missed and delayed care compared with other emergency department patients, reflecting workflow strain and competing priorities. [11] Joint Commission communications on boarding also emphasize its impact on patient care and clinician well being, which matters because burnout and safety are linked through attention, turnover, and reliability. [4]
Boarding is tightly linked to hospital occupancy and system capacity
A large multi hospital analysis in JAMA Network Open found that emergency department boarding time rose substantially during the pandemic period and was associated with hospital occupancy, reinforcing that output and capacity are key levers. [5]
Operational benchmarking data also show how big boarding has become in total time. Findings from the Emergency Department Benchmarking Alliance summit describe boarding time as a major portion of admitted patient emergency department length of stay, and note that other countries often refer to this as exit block. [6]
Boarding forces harmful tradeoffs
When many emergency beds are occupied by admitted patients, the department starts to ration emergency care capacity:
- Longer waits to see a clinician
- Higher left without being seen or walkaway rates
- More patients in hallways or non ideal spaces
- Delayed time sensitive treatment
These are not abstract. They show up in measures that the public, payers, and regulators increasingly track.
For example, CMS and related hospital quality reporting programs include emergency department throughput and walkaway measures such as median time from arrival to departure for discharged patients and left without being seen. [8]
The uncomfortable truth:
You cannot sustainably fix emergency crowding only inside the emergency department. You can temporarily cope with tactics like vertical care and fast track, but the multiplier is boarding. To reduce boarding, you must treat inpatient flow, discharge barriers, and post acute constraints as part of emergency care strategy.
Fragmented Care and Data Blind Spots: The Hidden Delays
Boarding is the visible logjam. Fragmentation is the invisible drag that makes every step slower.
The typical data blind spots in emergency care
- Recent outside ED visits, imaging, and lab results that are not visible at triage
- Medication history and adherence signals that are incomplete or delayed
- Specialty plans that live in another system or another institution
- Social determinants and support constraints that affect discharge safety
- Post acute capacity information that is not available until late in the visit
Each blind spot creates a predictable downstream effect: more duplicate testing, more consult dependence, longer observation, and more risk averse disposition decisions.
Why standards are necessary but not sufficient
HL7 FHIR is a standard for exchanging healthcare information electronically, and it is designed around modular resources that can support modern APIs and data exchange. [9] This is foundational because emergency clinicians need fast retrieval of concise, structured summaries rather than document dumps.
But even when exchange exists, usability often fails. Common failure modes include:
- Data arrives too late in the workflow
- The summary is too long to be actionable
- Key elements are unstructured and hard to search
- Identity matching is imperfect
- Clinicians do not trust the data quality
TEFCA as a practical enabler for 2026
The Trusted Exchange Framework and Common Agreement is intended to support nationwide exchange via Qualified Health Information Networks, and its operational timeline and policy details are managed through federal programs and the Recognized Coordinating Entity. [10]
For emergency care, the value is not theoretical. If implemented well, it can reduce time spent hunting for external records and lower duplicate testing. But the benefits depend on workflow integration: a clinician needs a usable external summary at triage and again at disposition, not a separate portal that adds clicks.
The informatics opportunity
Fragmentation is where informatics can pay for itself quickly. Every duplicated CT, every delayed consult due to missing history, every admission driven by uncertainty is both a cost and a flow tax. Reduce uncertainty earlier and you reduce downstream congestion.
Where Health Informatics Helps Most
The goal is not to build the fanciest dashboard. The goal is to reduce cycle time and make the right care decision faster and more safely.
Below are the highest leverage informatics interventions, in order of typical impact.
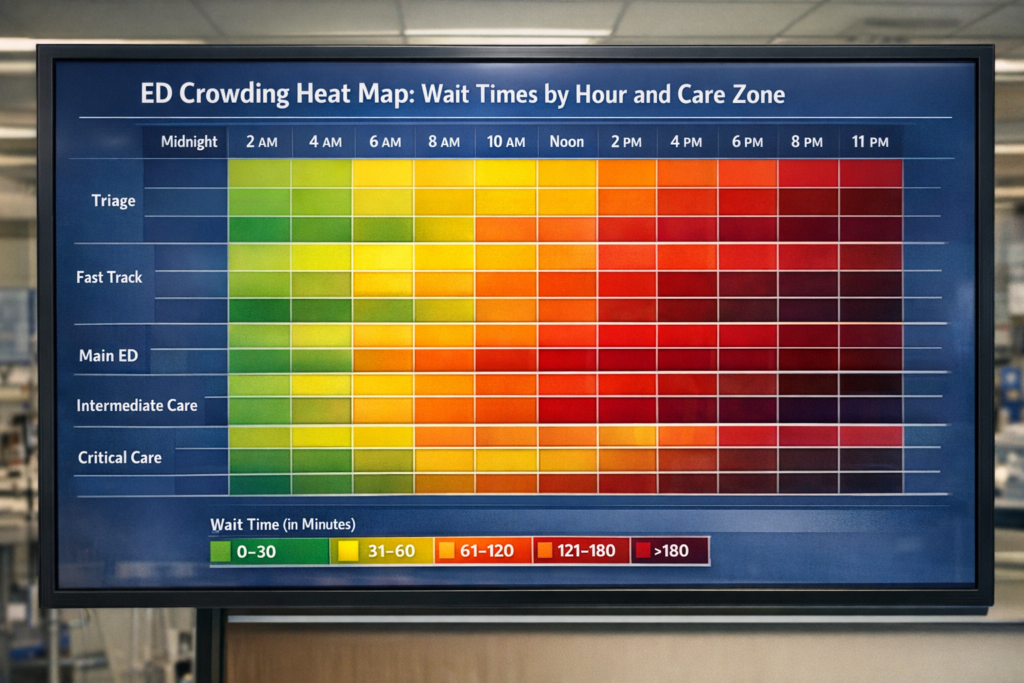
1) Real time flow visibility that clinicians actually use
Emergency departments often have multiple boards: one for triage, one for beds, one for labs, one for imaging, one for inpatient placement. Informatics can unify these into one operational view that answers:
- Who is waiting and why
- Which step is blocking progression
- Which patients are at risk of missing key time targets
- Which admitted patients are boarding and what the limiting constraint is
Benchmarking groups emphasize the importance of consistent operational definitions and measures so organizations can compare performance and act on it. [6]
2) Operational forecasting for demand and staffing
You do not need perfect prediction. You need useful prediction.
Forecasting can estimate arrival volume by hour, expected acuity mix, and likely admission rate. Then staffing and diagnostic capacity can be aligned to demand curves. This is especially important when boarding is high because you need surge staffing and surge protocols before the waiting room fills.
3) Smarter triage and routing to the right level of care
A large portion of emergency congestion is misrouting:
- Low acuity patients placed into high intensity beds
- High risk patients waiting too long in the lobby
- Behavioral health patients stuck in spaces not designed for them
- Patients who could be treated in observation, urgent care, or hospital at home pathways placed into inpatient queues
Decision support can help by standardizing risk assessment, recommending care zones, and prompting early orders that shorten time to disposition. The key is to focus on high signal tools and avoid noisy alerts that increase fatigue.
4) Standardized diagnostic pathways and order sets tied to flow goals
Clinical pathways are often written for clinical quality only. Informatics can align them with throughput by:
- Minimizing unnecessary labs and imaging
- Bundling orders that reduce repeat trips and delays
- Enabling nurse initiated protocols where appropriate
- Standardizing consult triggers and documentation
ACEP and other organizations have published high impact solutions emphasizing proxy metrics and system wide interventions, including monitoring bed status and reducing boarding time. [1]
5) Interoperability that delivers a usable emergency summary
This is where HL7 FHIR and TEFCA matter most:
- Medication history and allergies
- Recent imaging results and reports
- Problem list and major diagnoses
- Recent admissions and discharges
- Care plans and goals of care documentation
Better inputs reduce duplicate work and help clinicians decide discharge versus admission with more confidence. [9] [10]
6) Post acute and discharge coordination tools that unblock beds
The emergency department cannot fix discharge delays alone, but informatics can reduce friction:
- Early identification of discharge barriers
- Automated tasking for required documentation
- Visibility into skilled nursing and rehab placement status
- Standardized handoffs and referrals
This is critical because post acute delays keep inpatient beds occupied, which keeps boarded emergency patients stuck.
The FLOW Playbook For Emergency Care
The fastest way to turn informatics into throughput is to use a simple framework with measurable steps. Here is the FLOW playbook designed for emergency care leaders who want results in 90 to 180 days.
F: Forecast demand and capacity with simple operational forecasting
Objective: anticipate strain before it arrives.
What to forecast
- Arrivals by hour and day of week
- Acuity mix proxy such as triage level distribution
- Admission probability by hour
- Behavioral health volume signals
- Imaging and lab demand by hour
How to implement
- Start with historical arrivals and admissions from the EHR and registration system
- Build a simple baseline model such as moving average or seasonal pattern decomposition
- Add event modifiers like holiday weeks and local outbreaks if data is reliable
- Publish a daily forecast to charge nurses, imaging leads, bed management, and hospital operations
What to measure
- Forecast error by hour
- Staffing match score, planned versus needed coverage
- Queue growth indicators such as door to clinician time and waiting room count
Why it works
If you staff and stage resources before the wave hits, you reduce peak queues and prevent the compounding effect where delays create more delays.
Informatics deliverables
- A daily operations forecast view integrated into the flow dashboard
- Automated alerts only when forecasted arrivals exceed a defined threshold
- A standard surge playbook linked to forecast triggers
AHRQ flow guidance emphasizes system level measurement and coordinated interventions rather than isolated fixes. Forecasting is the simplest way to operationalize that coordination. [2]
L: Load balance across arrival channels and care zones
Objective: prevent the wrong patient from occupying the wrong resource.
Core idea: emergency care is not one queue. It is multiple queues with different service speeds.
Actions
- Create clear care zones: resuscitation, high acuity, moderate acuity, vertical care, observation
- Define routing rules tied to triage and risk flags
- Use real time occupancy and staffing to rebalance load
Examples of high impact load balancing
- Vertical care for low acuity patients with fast diagnostic turnaround
- Dedicated behavioral health pathway with defined evaluation steps and placement workflow
- Early observation placement for patients with predictable short stay protocols
- Direct to imaging for specific presentations when clinically appropriate
Metrics
- Zone level occupancy rate
- Time to clinician by zone
- Left without being seen or walkaway rate
- Patients in hallway spaces
CMS related quality reporting includes measures that reflect throughput and walkaways, which makes load balancing more visible to external stakeholders. [8]
Informatics deliverables
- Zone based dashboard tiles showing occupancy and queue length
- Routing prompts in triage documentation, focused on high risk misroutes
- Automatic identification of candidates for vertical care and observation based on presentation and risk rules
O: Optimize triage and diagnostics with decision support and smart order sets
Objective: shorten time to disposition by reducing uncertainty early.
This is where informatics often fails by doing too much. The winning strategy is to target a small set of high volume, high delay pathways.
Pick 5 to 8 pathways first
- Chest pain and shortness of breath
- Abdominal pain
- Suspected sepsis or infection
- Stroke or neurologic deficit
- Trauma and falls in older adults
- Behavioral health crisis evaluation
- Syncope or dizziness
- Dehydration and electrolyte disturbance
Design principles
- Decision support should be embedded in the triage and ordering flow, not a separate window
- Use defaults that reduce unnecessary variation
- Make the next step obvious: order bundle, reassessment time, disposition criteria
- Avoid interruptive alerts unless the harm risk is high
Operational impact
Boarding and crowding research and safety discussions highlight that delays in emergency care can be deadly for time sensitive conditions. [11] AHRQ emergency safety guidance notes that delays caused by crowding and boarding are a major safety concern. [2]
Informatics deliverables
- Pathway specific order sets with minimal clicks
- Nurse initiated protocols where policy allows
- Timers and task lists for reassessment, lab follow up, and imaging completion
- Simple risk stratification embedded in triage note templates
W: Work the board with real time visibility, escalation triggers, and clean handoffs
Objective: reduce boarding time and protect emergency capacity.
If boarding is the multiplier, board management is the control knob.
What the board should make obvious
- Decision to admit time
- Bed request time
- Assignment time
- Physical transfer time
- Reason for delay, such as no bed, cleaning delay, staffing, specialty placement, transport
Benchmarking literature emphasizes that boarding time is a major component of admitted patient length of stay and has worsened over time in many settings. [6] ED benchmarking data reports show ongoing increases in processing times and provide concrete reference points for boarding and door to decision intervals. [7]
Escalation triggers
- Boarding over 4 hours triggers a hospital operations escalation
- Boarding over 8 hours triggers a full capacity protocol consideration
- ICU level boarders trigger an ICU consult model and staffing adjustment
Handoff standardization
A major safety gap occurs when emergency teams continue to hold responsibility for boarded inpatients without inpatient level staffing and workflows. Standardizing handoffs and responsibility transitions reduces missed care. AHRQ safety findings show boarded patients experience more missed and delayed care, which underscores the need for reliable handoff and monitoring. [11]
Informatics deliverables
- A boarding scoreboard visible to inpatient leadership
- Automated reason codes for delays that are easy to select
- Structured handoff note templates that support inpatient takeover
- Queue based tasking for transport, cleaning, and consult completion
A practical sequence for a 90 to 180 day rollout
- Weeks 1 to 3: define metrics, validate data quality, align operational definitions
- Weeks 4 to 6: launch unified flow dashboard and daily forecast
- Weeks 7 to 10: implement two triage and diagnostic pathways and zone routing rules
- Weeks 11 to 14: implement boarding escalation triggers and handoff standardization
- Weeks 15 to 24: expand pathways, integrate external data retrieval workflows, refine forecasting and staffing alignment
This sequence works because it starts with visibility and measurement, then targets the highest leverage delays, then hardens governance and safety.
Implementation That Sticks: Governance, Workflow, and Safety
Great tools fail when governance and workflow design are weak. Here is how to avoid the most common failure modes.
1) Create a single owner for flow with cross functional authority
Emergency department leadership cannot solve inpatient discharge barriers alone. Assign a flow owner or flow council with authority across emergency care, inpatient units, bed management, case management, radiology, and behavioral health placement.
2) Treat measures as clinical grade data
If clinicians do not trust the timestamps, they will not trust the dashboard. Validate:
- Arrival time logic
- Triage completion time
- First clinician contact definition
- Decision to admit timestamp
- Departure time definition
Use published definitions where possible. Benchmarking groups explicitly call for shared definitions for operational measures to support meaningful comparisons. [6]
3) Design for low cognitive load
Every extra click is a tax. Keep decision support narrow, high signal, and tied to a clear benefit such as faster disposition or safer triage.
4) Monitor unintended consequences
If you push for speed without guardrails, you risk harm. Balance throughput metrics with:
- Return visits for specific conditions
- Adverse event signals
- Patient experience
- Staff turnover and overtime
Evidence and Case Examples Worth Copying
Emergency care improvement is not a mystery. The hard part is sustained execution.
Here are evidence anchored themes and examples that are worth copying, even if the specific implementation differs.
1) Full capacity protocols and inpatient pull models
The SAEM Boarding and Crowding Toolkit includes system strategies such as full capacity protocols and level loading across a health system. These approaches recognize that the emergency department is not an appropriate long term holding unit for admitted patients and aim to distribute burden more safely. [3]
2) Measurement driven accountability
A growing theme is that what gets measured gets managed. Research leveraging access measures shows worsening performance over time, which supports the push for standardized reporting and transparent improvement. [12]
Professional advocacy around the 2026 outpatient payment rule also frames new emergency department boarding measures as an accountability step, even though measurement alone does not fix capacity. [1]
3) Benchmarking to set realistic targets
The Emergency Department Benchmarking Alliance data report provides reference ranges for processing times and boarding metrics and highlights trends such as increases in door to decision time and walkaway rates. This helps leaders set targets that are aggressive but not fantasy. [7]
4) Safety focused mitigation for boarded patients
AHRQ safety literature documents more missed and delayed care in boarded patients, reinforcing the need for explicit mitigation steps: structured handoffs, monitoring protocols, and clarity of responsibility. [11]
The Path to a More Resilient Emergency Care System
America’s emergency care breaking point is real, but it is also diagnosable.
If you treat crowding as a waiting room problem, you will stay stuck in short term fixes. If you treat it as a system flow problem, the path becomes clearer: reduce boarding by improving inpatient throughput, reduce uncertainty early in the visit, and route patients to the right level of care without wasting scarce emergency capacity.
Health informatics is one of the fastest ways to get there in 2026 because it can make the invisible visible. A unified flow view turns guesswork into action. Forecasting prevents predictable surges from becoming crises. Decision support and pathways shorten time to disposition. Interoperability reduces duplicate work and lowers avoidable admissions. And escalation triggers force the system to respond when boarding crosses safety thresholds.
The outcome is not just faster care. It is safer care, less burnout, fewer walkaways, and an emergency department that can be ready for the next true emergency.
More Articles on Informessor:
1 in 3 Home Care Patients End Up Hospitalized. This AI Platform Is Built to Stop That.
I stumbled on BetweenVisits.org a little while back and, honestly, I couldn’t stop thinking about…
How Ambient AI Scribes Are Reshaping Health Informatics Careers in 2026
There’s a quiet revolution happening inside exam rooms across the country, and most people outside…

Top Health Informatics News From Q1 2026: What You Need to Know
Health informatics had a busy 1st quarter in the US, and honestly, a lot of…

The Hidden Costs of Bad Data in Healthcare
In hospitals, healthcare data is not just a record of what happened. It is the input that…

How Health Informatics Transforms Patient Outcomes
If you have ever wondered why a correct diagnosis does not always translate into better…
Healthcare Data Quality Framework to Fix Broken Dashboards
If you have ever shipped a dashboard you were proud of, only to watch it…

References
- American College of Emergency Physicians. Emergency Department Boarding and Crowding. ACEP website. Accessed December 2025. (acep.org)
- Agency for Healthcare Research and Quality. Improving Patient Flow and Reducing Emergency Department Crowding. AHRQ guide and background materials. (AHRQ)
- Society for Academic Emergency Medicine. Boarding and Crowding Toolkit. SAEM publications. (Default)
- The Joint Commission. ED Boarding Impact on Patient Care and Clinician Well Being. Joint Commission news and journal highlight. (Joint Commission)
- Janke AT, Melnick ER, Venkatesh AK. Hospital Occupancy and Emergency Department Boarding During the COVID 19 Pandemic. JAMA Network Open. 2022. (JAMA Network)
- Richey D, Schmitz G, Jarou Z, Jouriles N. Findings from the Fifth Emergency Department Benchmarking Alliance Summit. 2025. (PMC)
- Emergency Department Benchmarking Alliance. A New Normal. 2024 Data Performance Report. Published 2025. (IEPC)
- Centers for Medicare and Medicaid Services. Hospital quality reporting measures and ED throughput related measures. CMS provider data and program information. (CMS Data)
- HL7 and Office of the National Coordinator for Health IT. HL7 FHIR overview and federal FHIR standards summary. (HL7)
- Office of the National Coordinator for Health IT and Sequoia Project RCE. TEFCA overview and operational timeline. (HealthIT.gov)
- Agency for Healthcare Research and Quality PSNet. Evidence on missed and delayed care for boarded patients. (PSNet)
- Sangal RB, et al. Emergency Care Access Based on a Proposed CMS Measure, trends 2017 to 2024. JAMA Health Forum. 2025. (JAMA Network)
- Associated Press and Side Effects Public Media. Reporting on ER boarding and prolonged waits for older adults. Published April 15, 2025. (AP News)